Mathesthesia
Have you ever wondered what y = x sounds like?
Mathesthesia is based off of "chromesthesia," or the ability to see colors when a musical note is played. However, instead of pairing music with colors, we pair music with mathematical equations with different features of music, using pitch and duration, to audibly demonstrating the "movement" of an equation in terms of slope and periods of increasing/decreasing values.
Listen Here!
All graphs were created using Desmos***
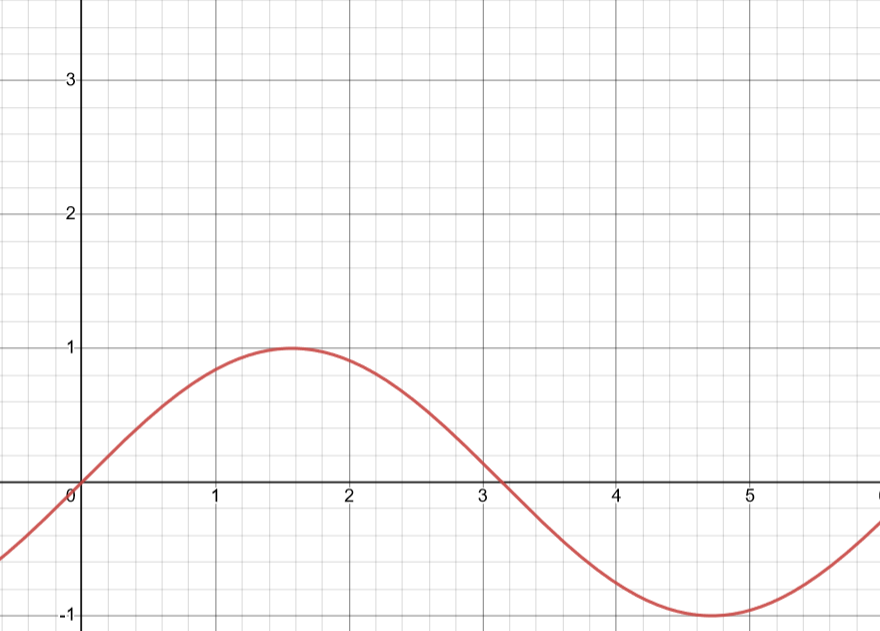
The graph and audio file of y = sin(x).
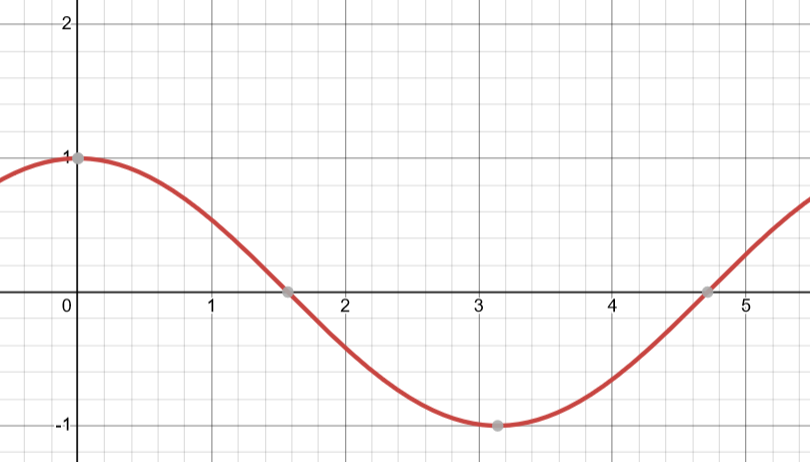
The graph and audio file of y = cos(x).
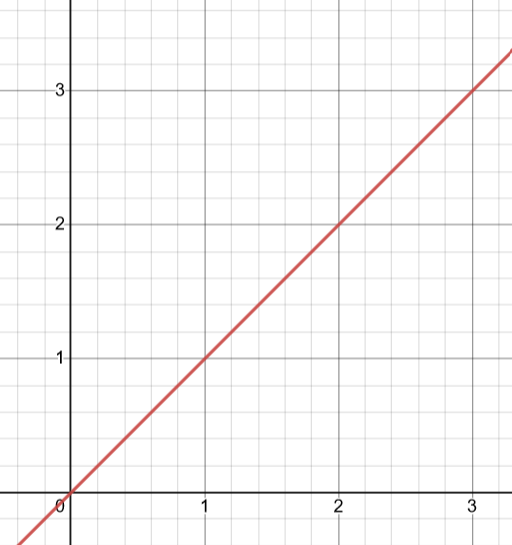
The graph and audio file of y = x.
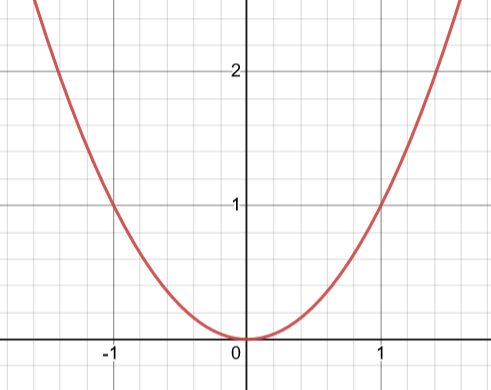
The graph and audio file of y = x^2.
Bonus: What happens when the equation is not a function?
Patterns?! Patterns!
Mathesthesia demonstrates increasing and decreasing intervals using ascending and descending pitches. The function y = x^2 has more noticeable jumps in pitches than the function y = x. The different starting positions and oscillation of sin(x) and cos(x) are easily demonstrated using different starting pitches and ascending/descending pitches. Mathesthesia can even audibly depict when an equation is not a function by playing pitches at the same time where the equation fails the vertical line test.
How it Works
Mathesthesia uses the x-coordinates of an equation to set music duration. Duration is calculated by calculating the distance between two x values in an equation. At the moment, Mathesthesia treats every equation as if its domain and range are discrete, to minimize complexity. The y-axis is is mapped to pitches and octaves on the C Major scale ( C D E F G A B ). As the range increases, the octave increases. Mathesthesia is written in Java using the music library, JFugue to create MIDI files. The back-end Mathesthesia is not connected to the front-end currently; samples were generated using Mathesthesia and the resultant MIDI files are displayed here.